

In Matchday 20 of the 2019/20 Serie A, Simone Inzaghi’s Lazio defeated Claudio Ranieri’s Sampdoria 5-1 at the Stadio Olimpico. Below, a statistical analysis of the game between the Biancocelesti and the Blucerchiati.
Lazio vs Sampdoria: Expected Goals (xG) Step Plot
 Step Plot, Source- @TacticsPlatform")
The diagram above represents a summary of all simulations. The y-axis represents the cumulative xG (how many goals should be scored) and the x-axis represents time.
Lazio had a cumulative xG of 3.88 and Sampdoria had a cumulative xG of 0.41.
In addition, the diagram above summarizes every shot taken by each club. Each shot is represented by a step and the height of the step measures the xG outcome of that shot; the higher the step, the more likely that the shot taken should have been converted.
The Biancocelesti had 15 total shots (8 shots on target) and the Blucerchiati had 9 total shots with (4 shots on target) in the match.
A dot with a name on the ‘Expected Goals Step Plot’ represents when a goal was scored and who the goal was scored by.
As pictured above, the goalscorers were Felipe Caicedo (7′), Ciro Immobile (17′, 20′, 65′), Bastos (54′), and Karol Linetty (70′).
Finally, the colored bar in the top left of the diagram shows the probability of each club winning the match or a draw occurring.
The probability of Lazio winning the match was 98%, the probability of Sampdoria winning the match was 0%, and the probability of a draw occurring was 2%.
Lazio vs Sampdoria: Outcome Probability Bar Chart

Each chart in the diagram above is a summary of a 10,000-time simulation of the probability of how many goals Lazio (most likely 4) and Sampdoria (most likely 0) should have scored; the colored bar is the actual number of goals the Biancocelesti (5) and the Blucerchiati (1) scored.
Lazio vs Sampdoria: Pass Network Plot & Shot Location Plot
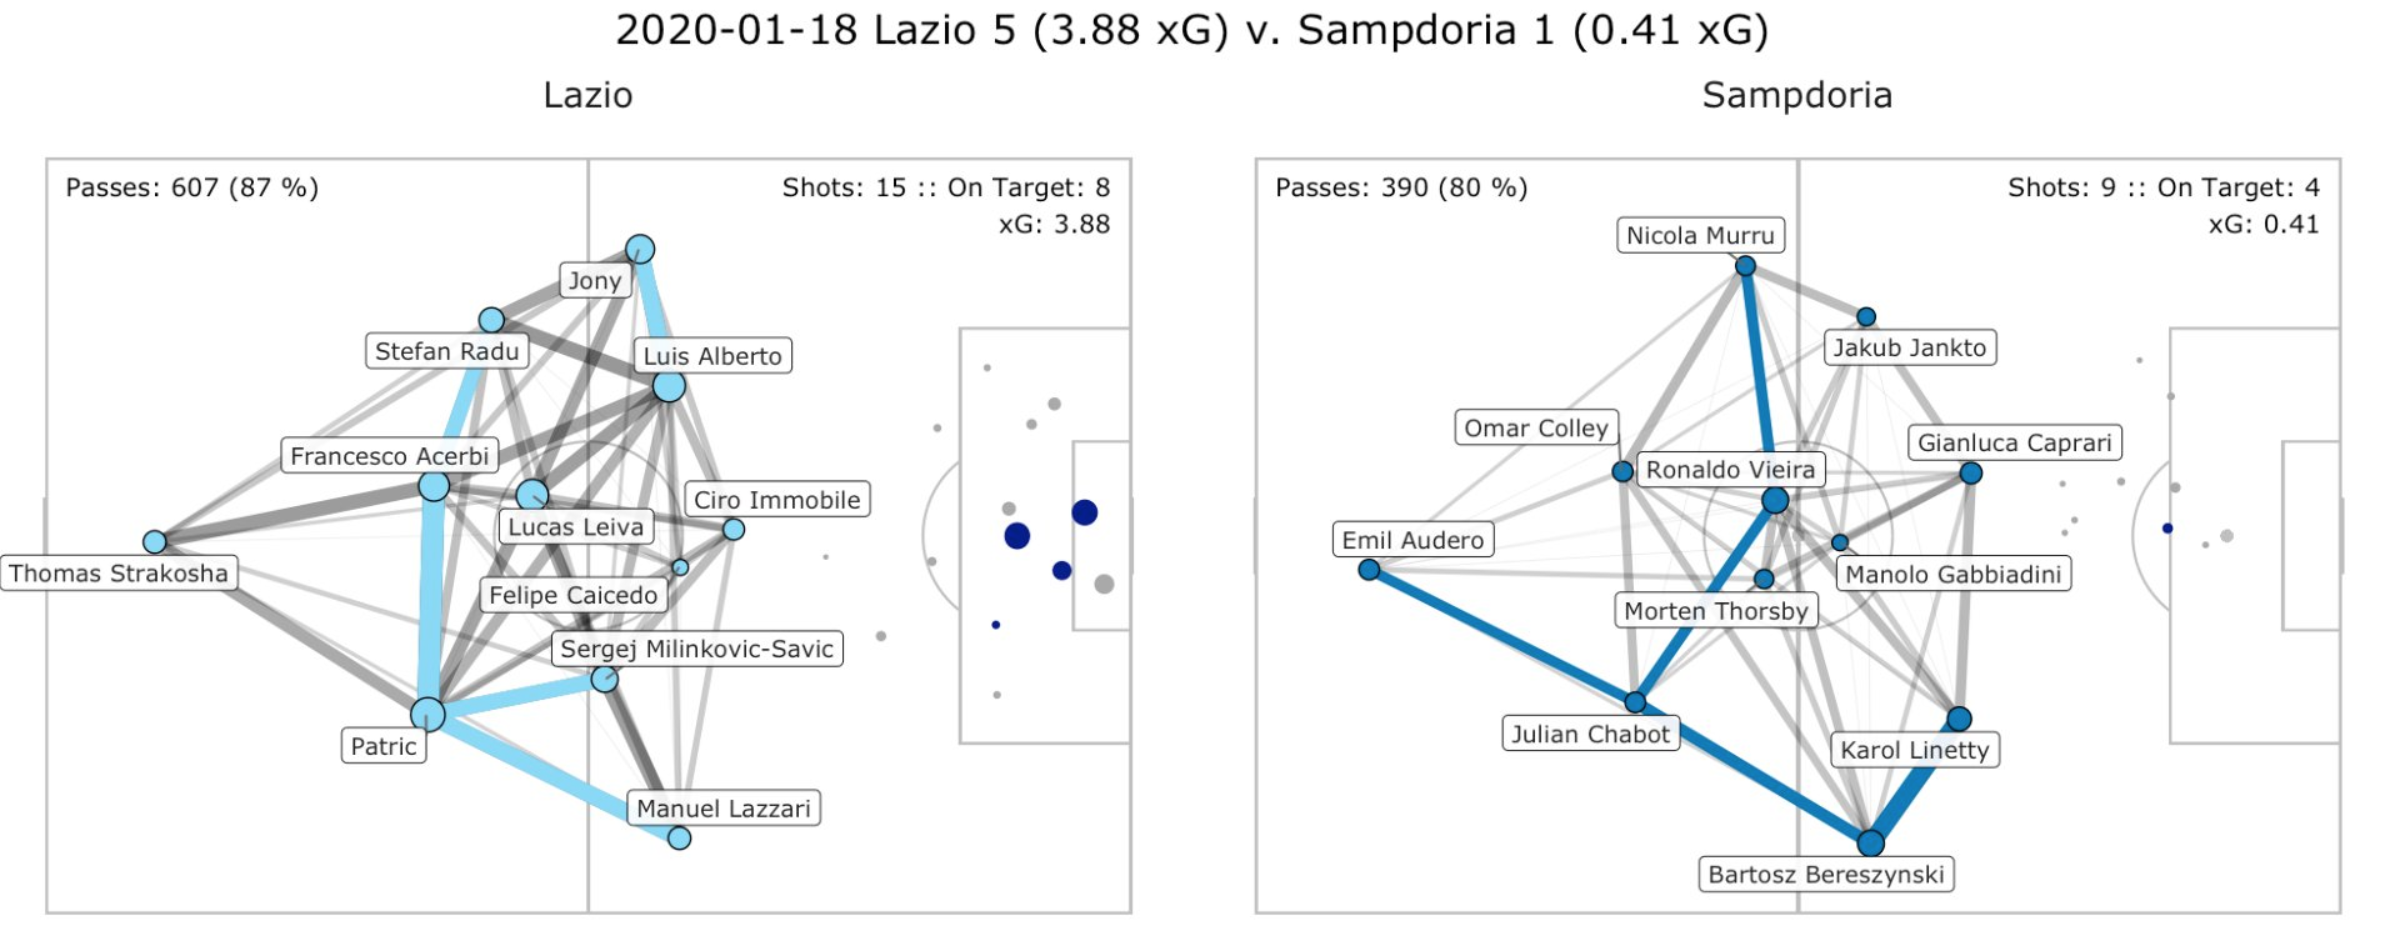
The diagram above shows the pass connection between players, represented by nodes. The size of each node denotes the number of touches each player has while the size and shade of the line between players indicates the frequency of the pass connection. The direction of the connection is not shown. In addition, this diagram shows the coordinate of where each shot was taken, plotted as dots. The size of the dot shows the xG; the bigger the dot, the higher the chance that the ball should be finding the back of the net. The colored dark blue dots represent goals.
Overall, Lazio had 607 passes with an 87% accuracy rate while Sampdoria had 390 passes with an 80% accuracy rate. As seen in the diagram above, Lazio’s most active players on the ball were Patric, Francesco Acerbi, Lucas Leiva, Jony, and Luis Alberto; Sampdoria’s most active players on the ball were Ronaldo Vieira, Karol Linetty, Bartosz Bereszynski, Julian Chabot, and Gianluca Caprari. In addition, the five main connections for Inzaghi’s men were between Jony-Luis Alberto, Radu-Acerbi, Acerbi-Patric, Patric-Milinkovic, and Patric-Lazzari; the five main connections for Ranieri’s men were between Audero-Chabot, Chabot-Ronaldo Vieira, Ronaldo Vieira-Murru, Bereszynski-Linetty, and Chabot-Bereszynski. These aforementioned connections are outlined in light blue (Lazio) and blue (Sampdoria).
This content is part of the collaboration between The Laziali and Cheuk Hei Ho.


