

In Matchday 8 of the 2019/20 Serie A, Simone Inzaghi’s Lazio drew Gian Piero Gasperini’s Atalanta 3-3 at the Stadio Olimpico. Below, a statistical analysis of the game between the Biancocelesti and the Nerazzurri.
Lazio vs Atalanta: Expected Goals (xG) Step Plot
 Step Plot, Source- @TacticsPlatform")
The diagram above summarizes every shot taken by Lazio (17 in total, 5 on target) and Atalanta (22 in total, 9 on target) in the match. Each shot is represented by a step and the height of the step measures the xG outcome of that shot; the higher the step, the more likely that the shot taken should have been converted. A dot with a player’s name represents when a goal was scored; as pictured above the goalscorers were Luis Muriel (23′, 28′), Alejandro Papu Gomez (37′), Ciro Immobile (69′, 90+2′) and Joaquin Correa (70′). The coloured bar in the top left shows the probability of the Lazio winning the match (38%), Atalanta winning the match (38%), or a draw occurring (23%). Better known as a summary of all simulations, the y-axis represents the cumulative xG – how many goals should be scored – and the x-axis represents time. The Biancocelesti had a cumulative xG of 2.45 and the Nerazzurri had a cumulative xG 2.48.
Lazio vs Atalanta: Outcome Probability Bar Chart

Each chart in the diagram above is a summary of a 10,000-time simulation of the probability of how many goals Lazio (most likely 2) and Atalanta (most likely 2) should have scored; the colored bar is the actual number of goals the Biancocelesti (3) and the Nerazzurri (3) scored.
Lazio vs Atalanta: Pass Network Plot & Shot Location Plot
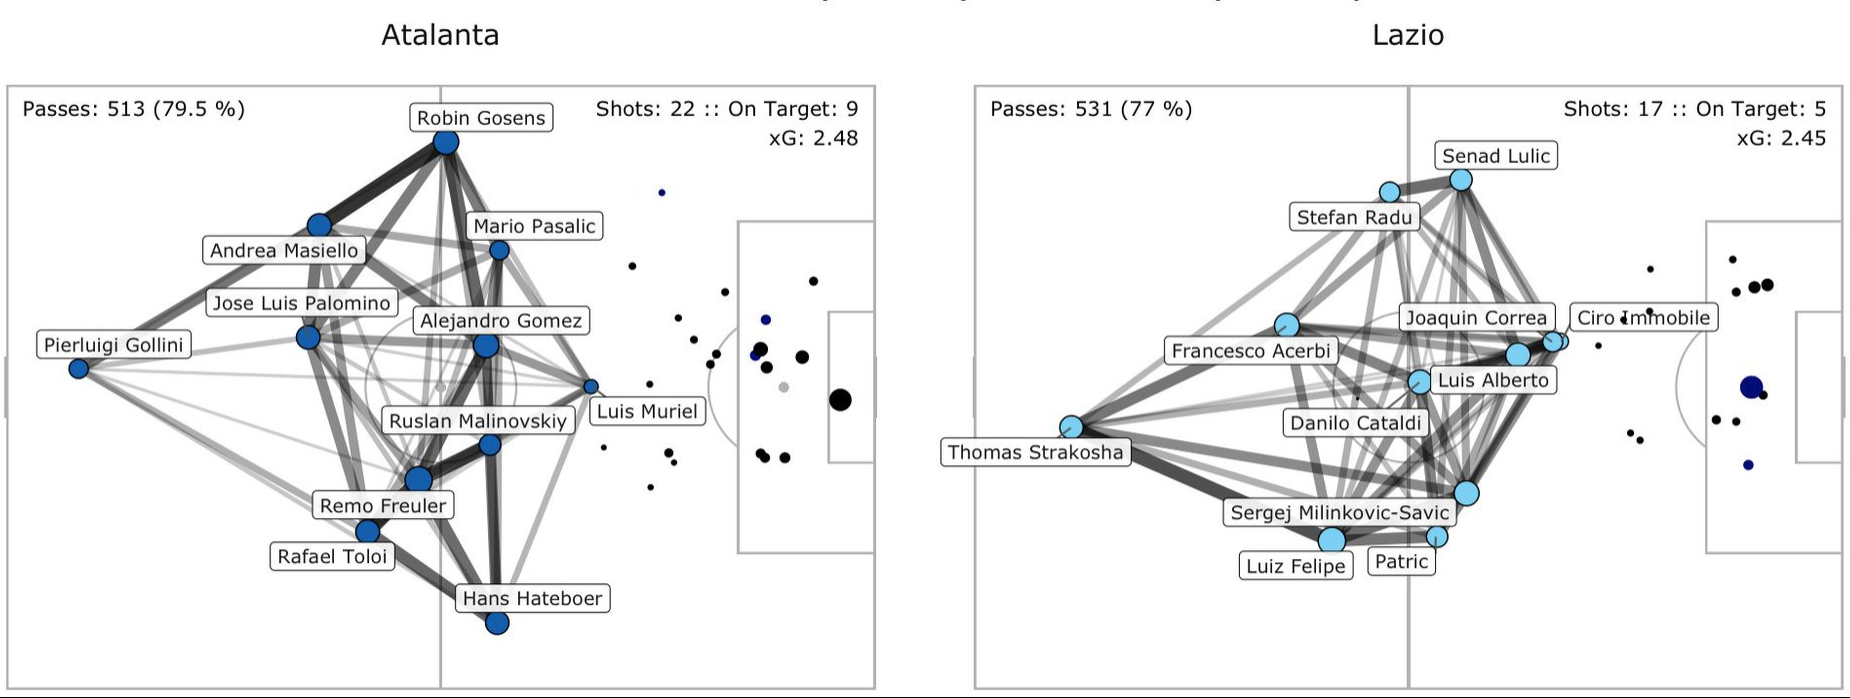
The diagram above firstly shows the pass connection between players, represented by nodes. The size of each node denotes the number of touches each player has while the size and shade of the line between players indicates the frequency of the pass connection. The direction of the connection is not shown. As seen, Atalanta’s most active players on the ball were Gomez, Remo Freuler, and Robin Gosens; Lazio’s most active players on the ball were Luiz Felipe, Francesco Acerbi, and Sergej Milinkovic-Savic. In addition, three main connections for Gasperini’s men were between Andre Masiello-Gosens, Rafael Toloi-Freuler, and Freuler-Malinovskiy; three main connections for Inzaghi’s men were between Thomas Strakosha-Luiz Felipe, Milinkovic-Savic-Correa, and Danilo Cataldi-Correa. Secondly, this diagram shows the coordinate of where each shot was taken, plotted as dots. The size of the dot shows the xG; the bigger the dot, the higher the chance that the ball should be finding the back of the net. Colored dots represent goals. Overall, Lazio had 531 passes with a 77% accuracy rate while Atalanta had 513 passes with a 79.5% accuracy rate.
This content is part of the collaboration between The Laziali and Cheuk Hei Ho.


